What it is
ASOS, the Automated Surface Observing System, is the weather station at most U.S. airports. The Weather Service, the Federal Aviation Administration and the Defense Department run it together. It is a set of sensors and a computer. They measure the wind, temperature, dew point, pressure, visibility, cloud, precipitation and present weather, and send a report every hour and whenever the weather changes enough to matter to a pilot. Its reports are the backbone of the country's surface record and of every forecast that starts from it.
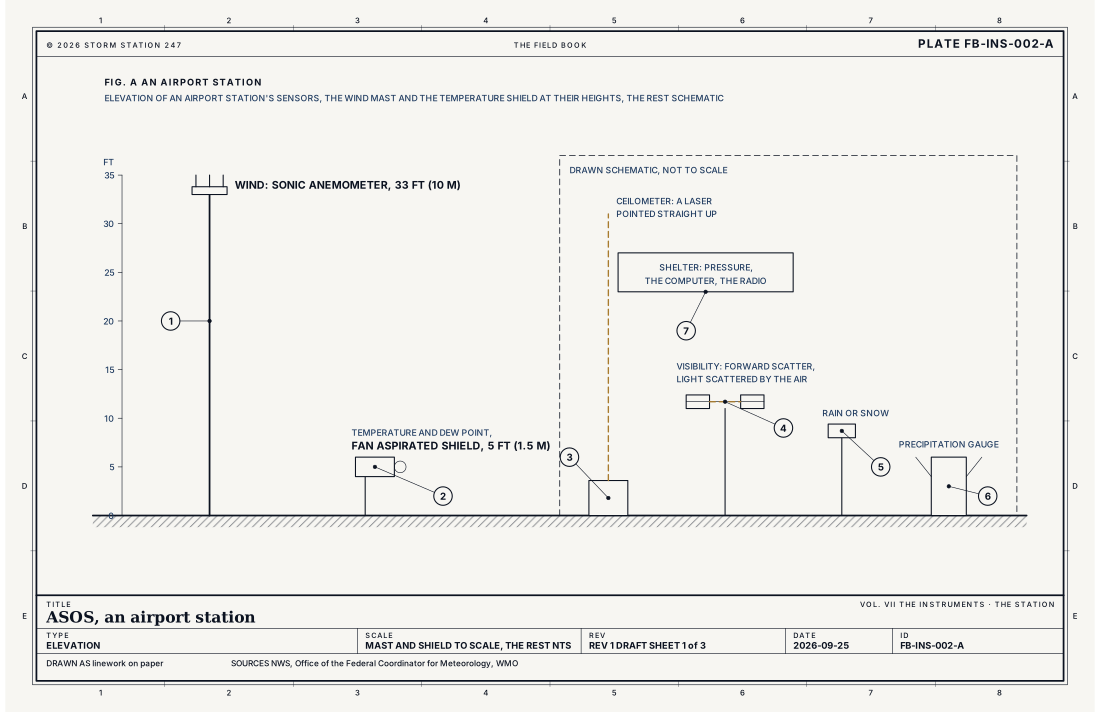
Fig. A draws a station. The wind sensor stands on a mast 33 ft (10 m) tall, the standard height for wind, above the slowing of the ground. The temperature and dew point sensor sits in a fan aspirated shield at about 5 ft (1.5 m), Stevenson screen and siting FB-INS-009. Beside them, drawn schematic, are a ceilometer that fires a laser straight up and times the echo from cloud bases, a forward scatter sensor that measures visibility from the light the air scatters, a present weather sensor that tells rain from snow, a precipitation gauge in its wind shield, and a shelter holding the barometers and the computer.
What it is not
It is not a person looking at the sky. The ceilometer sees only the cloud passing over it, and the visibility sensor only a small sample of air. At larger airports trained observers watch the automated report and add what the sensors cannot see.
It is not an instant reading. Every reported value is an average over its own window, and a sudden gust or a thin patch of fog can fall between them.
Lookalikes
- A personal weather station
- Sited wherever its owner can, and not held to the airport standards; useful in numbers, Personal weather station FB-INS-003.
- A human observer
- At larger airports trained observers watch the automated report and add what its sensors cannot see, such as a distant thunderstorm or the kind of cloud.
The machine
Averaging
Fig. B draws the windows. The reported wind is the mean of the last 2 minutes; its gust is the highest 5 second wind of the last 10. The temperature and dew point are 5 minute means. The visibility is drawn from the last 10 minutes of the sensor's readings. The sky is built from the last 30 minutes of ceilometer echoes, the most recent 10 counted twice, because the ceilometer sees one point and the wind must carry the sky over it. Clouds are reported up to 12,000 ft (3.7 km); higher cloud needs an observer or a satellite.
The report
Each hour, near 53 minutes past, the station sends a routine report, a METAR, and between them special reports when the weather crosses a threshold such as a falling ceiling or thickening fog. Fig. C decodes one, an example written for the sheet rather than a real report. It carries the wind from 270° at 15 knots, 17 mph, gusting 25 knots, 29 mph, and the temperature to the whole degree Celsius in its body. In its remarks it gives the sea level pressure, 1,013.1 mb, and the temperature and dew point to a tenth: 71.1 °F (21.7 °C) and 46.9 °F (8.3 °C), 42 per cent humidity, Humidity variables FB-WAT-002.
Checking itself
The station compares its sensors before it reports. Its barometers are checked against each other, and a sensor that fails its checks drops out of the report rather than sending a bad value. A report missing an element is a report telling the truth.
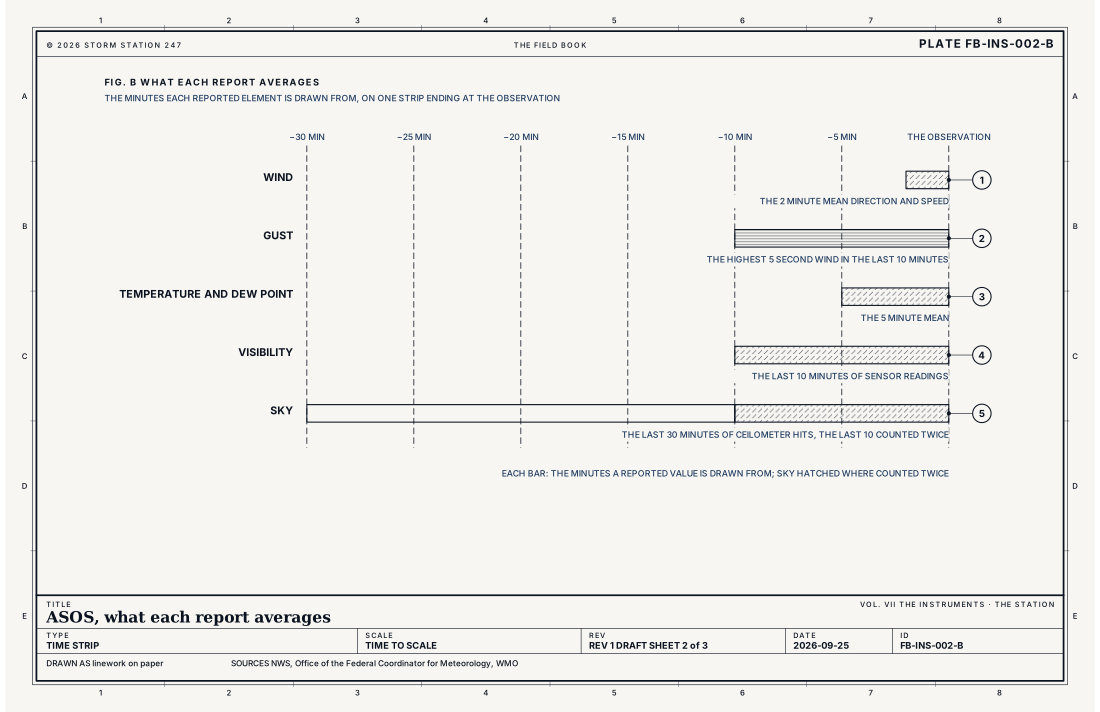
- Wind, 2 minutes
- Gust, 10 minutes
- Temperature and dew point, 5 minutes
- Visibility, 10 minutes
- Sky, 30 minutes
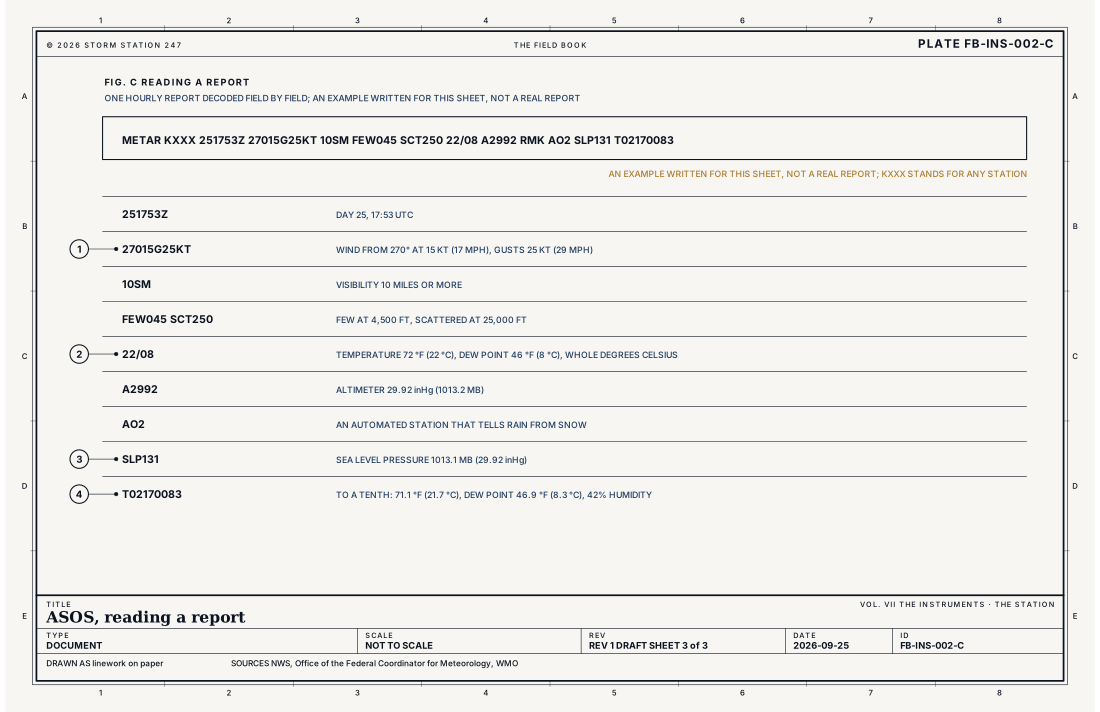
- The wind and its gust
- The temperature and dew point, whole degrees
- The sea level pressure
- The temperature and dew point, to a tenth
Ingredients
- Sensors for each element, sited on the airfield to the standards of the Federal Meteorological Handbook
- A computer that averages each element over its own window and writes the report
- Quality checks that compare sensors with each other and with limits before a value is sent
Scales
- time
- sensors read every minute or faster; a routine report each hour, and special reports between
- horizontal
- a point, at the airport; the sky and visibility sensors see a few miles at most
- vertical
- from the ground to 12,000 ft (3.7 km), the highest cloud its ceilometer reports
- orlanski
- micro
Signatures
- surface
- a report every hour near 53 minutes past; and special reports between when the weather changes
The numbers
| Quantity | Value, and the kind of number it is |
|---|---|
| Wind sensor height | 33 ft (10 m) above the ground, the standard exposureStandard, Automated Surface Observing System (ASOS) User's Guide |
| Temperature sensor height | About 5 ft (1.5 m), in a fan aspirated shieldTypical, Automated Surface Observing System (ASOS) User's Guide |
| Reported wind | The 2 minute mean direction and speed; the gust, the highest 5 second wind in the last 10 minutesStandard, Automated Surface Observing System (ASOS) User's Guide |
| Reported temperature and dew point | The 5 minute mean, to the whole degree Celsius in the report's body and to a tenth in its remarksStandard, Automated Surface Observing System (ASOS) User's Guide |
| Reported sky | Cloud layers to 12,000 ft (3.7 km) from the last 30 minutes of ceilometer readings, the last 10 minutes counted twiceStandard, Automated Surface Observing System (ASOS) User's Guide |
| Reported visibility | Up to 10 miles (16 km), from the last 10 minutes of sensor readingsStandard, Automated Surface Observing System (ASOS) User's Guide |
| Report schedule | A routine report (METAR) each hour, and a special report (SPECI) when the weather crosses set thresholdsStandard, Federal Meteorological Handbook No. 1 |
How the station sees it
This is the station. Its reports reach this site each hour, and every airport station's page shows its latest reading and its record. Its pressure is worked down to sea level for the map, Hydrostatic balance FB-ENG-003, and its visibility names fog when it falls below 5/8 mile, Fog types FB-WAT-020.
- Airport weather stations: every element on this plate, each minute, from every airport station the site carries
How it is warned
ASOS does not warn. Its readings confirm warnings and verify them afterwards: the gust that met a warning's threshold, the visibility under a fog advisory, the inch of rain in an hour. Forecasters watch its minute by minute data as a storm arrives.
See also
- What an instrument is FB-INS-001
- Stevenson screen and siting FB-INS-009
- Station model FB-STN-002
- Humidity variables FB-WAT-002
- Fog types FB-WAT-020
- Hydrostatic balance FB-ENG-003
Sources
- National Weather Service. Automated Surface Observing System (ASOS) User's Guide.
- Office of the Federal Coordinator for Meteorology. Federal Meteorological Handbook No. 1, Surface Weather Observations and Reports.
- World Meteorological Organization. Guide to Instruments and Methods of Observation (WMO-No. 8).
Definition after the Automated Surface Observing System (ASOS) User's Guide. Plate FB-INS-002, revision 1, 2026-09-25. The number is permanent; cite it.