What it is
The tide is the slow rise and fall of the sea, twice a day on most coasts, driven by the moon and the sun. It is the one part of the water level that can be predicted years ahead, to the minute, at any gauge that has been measured long enough.
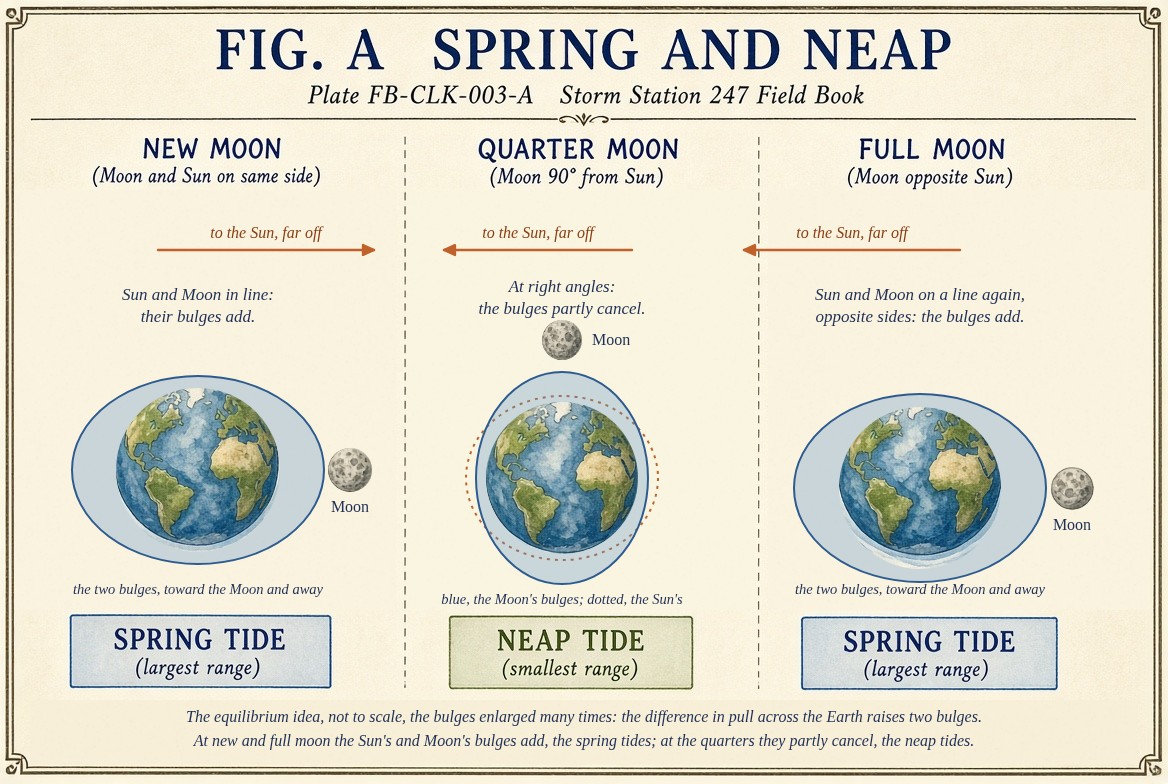
The moon and the sun do not simply pull the ocean toward them. They pull on the whole earth, and they pull harder on the side nearer to them than on the far side. The difference between the pull at a point on the earth and the pull at its centre is the tidal force. It stretches the ocean along the line to the moon, toward the moon on the near side and away from it on the far side. That is why there are two tides a day and not one.
What it is not
It is not the storm surge, and it is not a coastal flood. The tide is the base the weather builds on: a coastal flood is the surge added to the tide, and it comes at high tide, Coastal flood FB-EVT-105.
The two bulges of Fig. A are not the real ocean. They are the equilibrium tide, the shape the ocean would take if it could follow the moon instantly across a planet covered in water. The real ocean cannot: the continents block it and the tide wave cannot travel fast enough. So the tide moves around each ocean basin as rotating waves, circling points where the range is near zero, and each coast has its own timing and its own range. The equilibrium cartoon explains the rhythm; the gauge measures the tide.
Lookalikes
- Storm surge
- The part of the water level the weather adds on top of the tide. The gauge shows it as observed less predicted. That is Storm tide, storm surge and wave runup FB-EVT-112.
- Seiche
- A basin sloshing at its own period after a storm or a pressure jump, in a lake or a bay. That is Seiche FB-EVT-110.
- Tidal wave
- An old name for a tsunami, which has nothing to do with the tide. The Book does not use it.
The machine
The tidal force from a body grows with its mass and falls with the cube of its distance, as the equation below says. The sun is 27 million times heavier than the moon but 389 times farther away, and the cube wins: the sun's tidal force is 0.46 of the moon's.
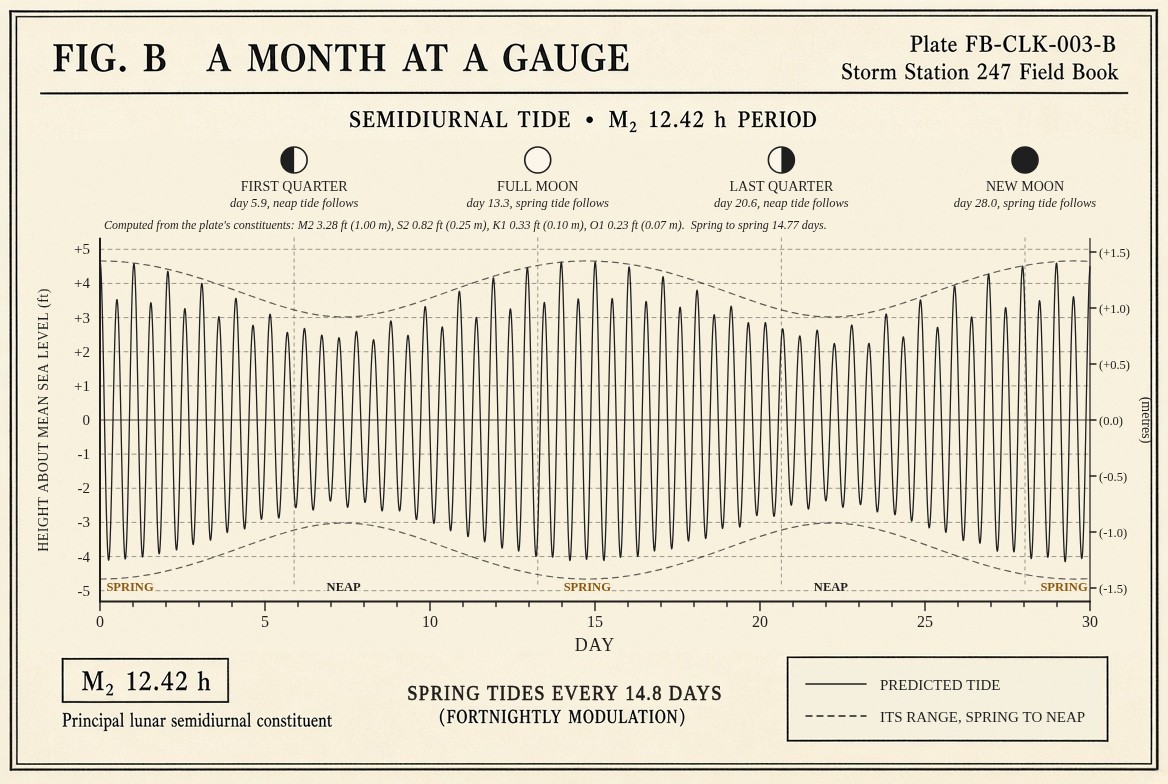
The daily rhythm. The earth turns under the moon's pull once every lunar day, 24 h 50 min, because the moon moves along its orbit as the earth turns. On a coast with a semidiurnal tide there are two highs and two lows in that time, one every 12 h 25 min: the main lunar constituent, M2.
The fortnightly rhythm. Near new and full moon the sun and the moon are in line and their tidal forces add: the range is largest, the spring tides, which come a day or two after the phase. At the first and last quarters they pull at right angles and partly cancel: the neap tides. From spring to spring is 14.77 days, half the month of phases. Fig. B draws a month of it at one gauge.
The distance. The moon's orbit is not a circle. At its closest, its tidal force is about a quarter stronger than at its mean distance. A spring tide that falls near perigee is a perigean spring tide, the king tide, and it is the highest of the year on many coasts even in calm weather.
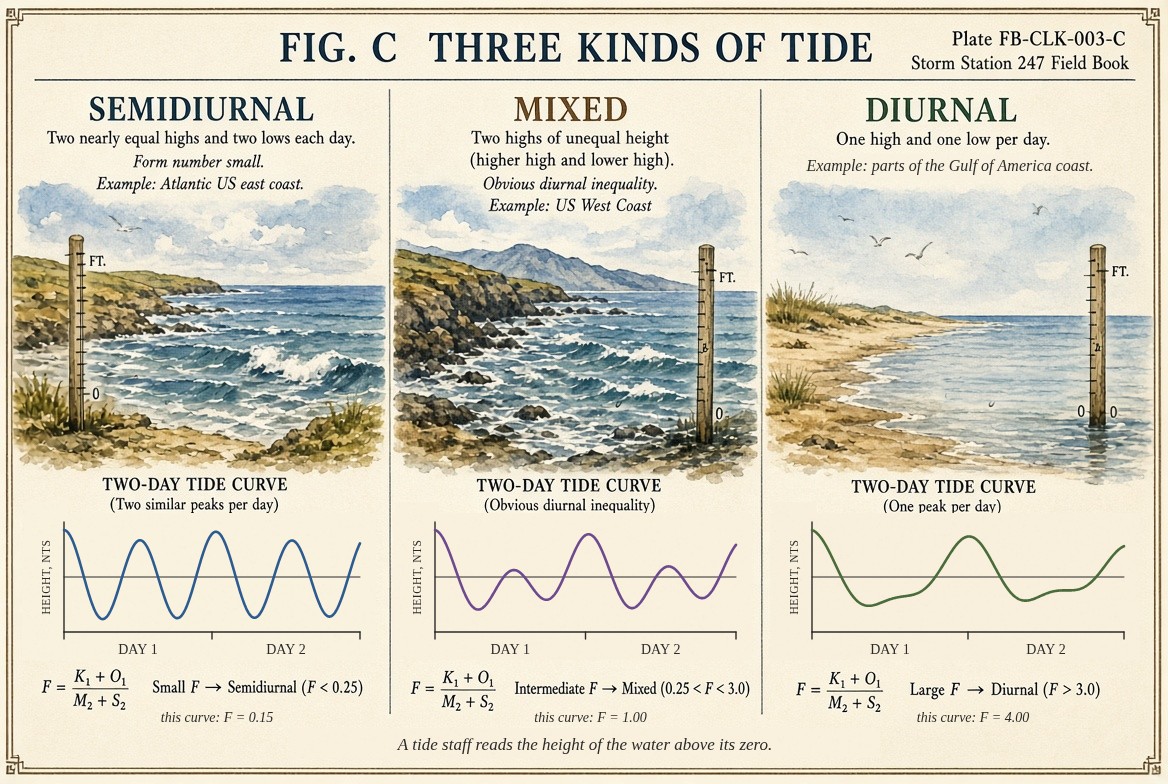
The declination. The moon moves north and south of the equator each month. When it is far from the equator the two daily tides differ in height: the diurnal inequality. Where the ocean's response favours the daily constituents over the twice daily ones, a coast has one tide a day. The form number below sorts the kinds. Fig. C draws them: most of the Atlantic coast is semidiurnal, the Pacific coast mixed, and parts of the Gulf coast diurnal.
The drawings
Each figure drawn as an engineering sheet, its parts numbered, to print at 11 by 17.
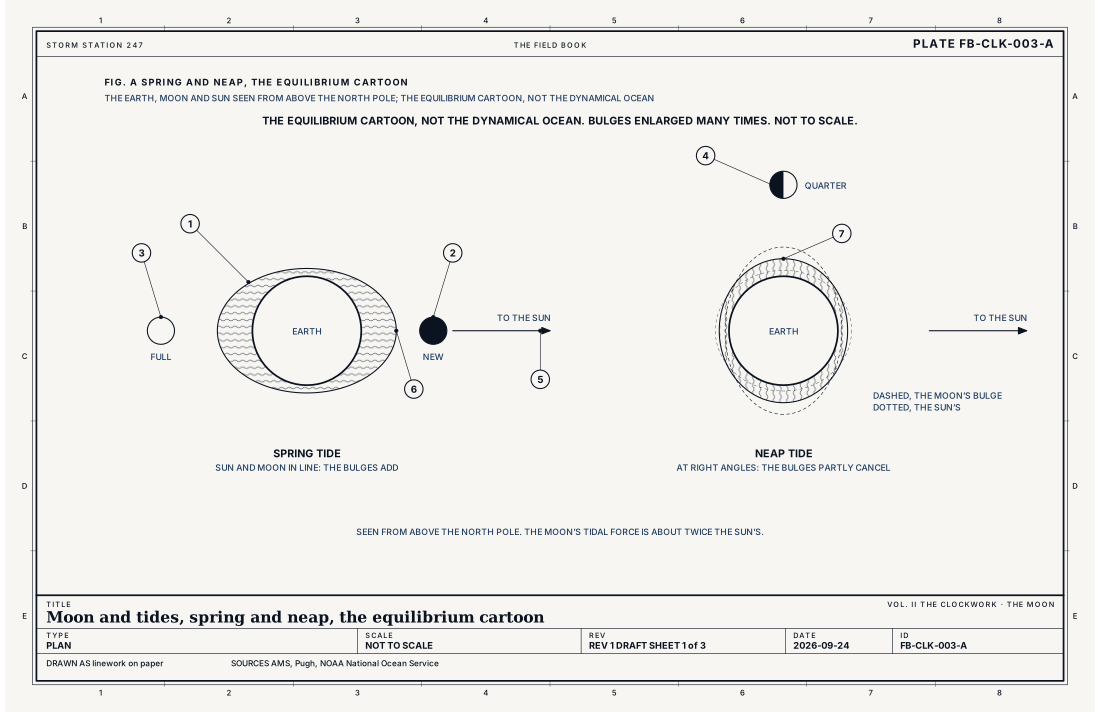
- The earth, and its bulges
- The moon, at new moon
- The moon, at full moon
- The moon, at a quarter
- The sun, far out of the drawing
- Spring tide, the bulges added
- Neap tide, the bulges opposed
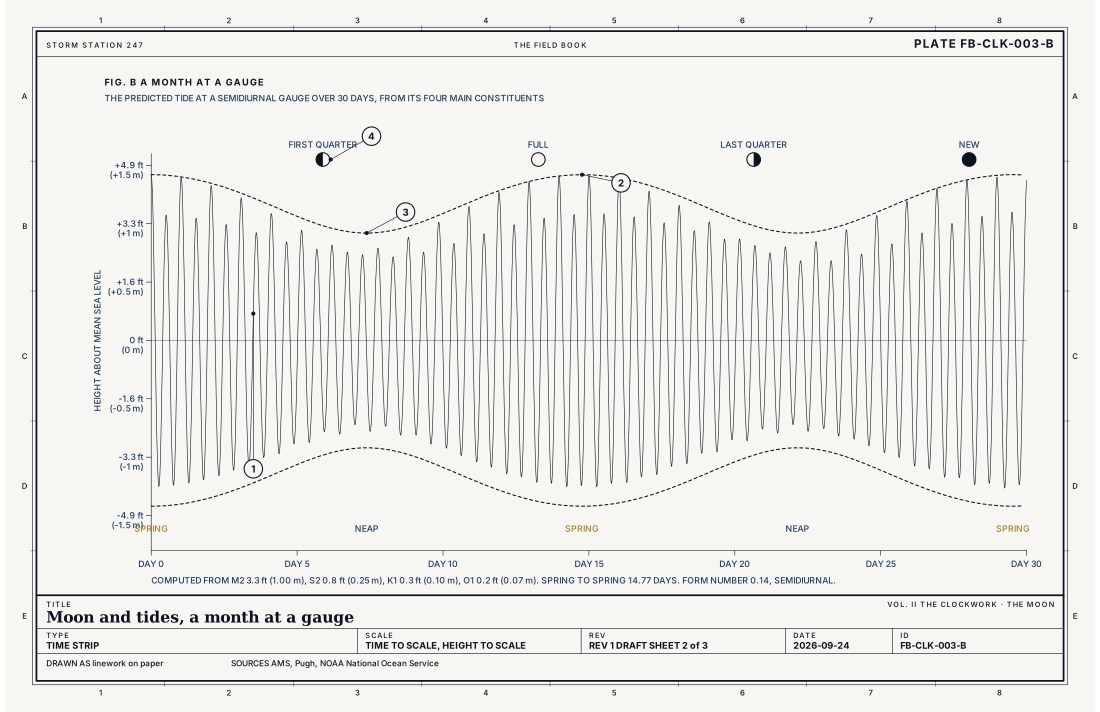
- The tide, twice a day
- Spring tides
- Neap tides
- The phases of the moon
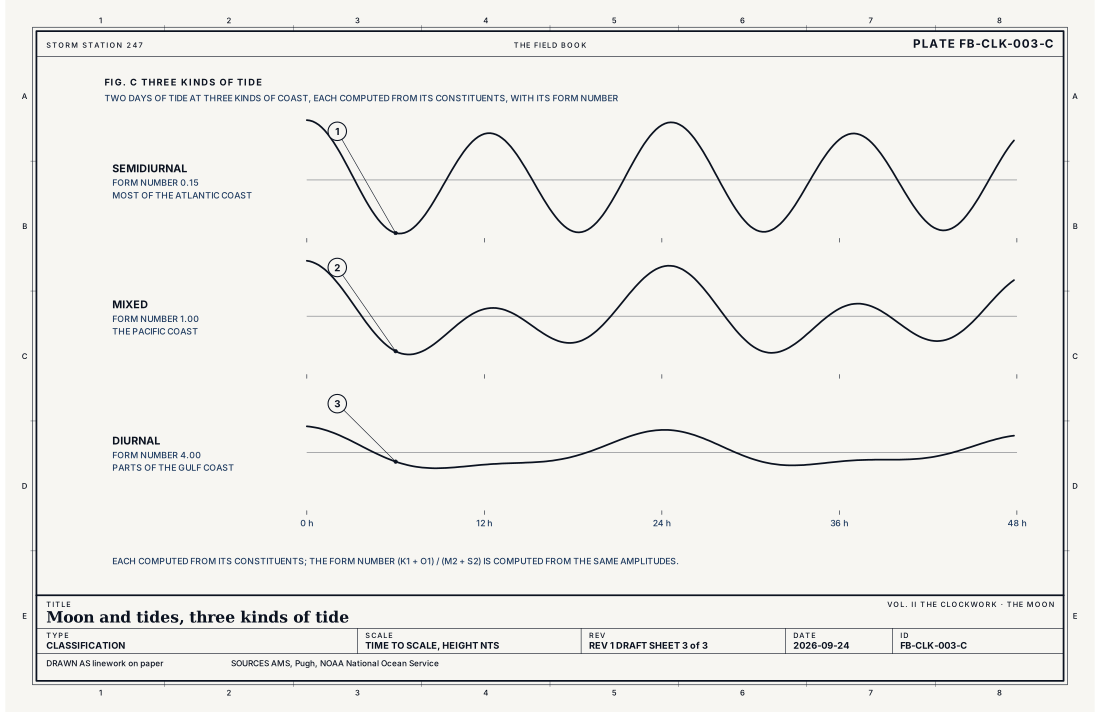
- Semidiurnal
- Mixed
- Diurnal
Ingredients
- The moon, whose tidal force on the earth is about twice the sun's
- The sun, adding to the moon near new and full moon, and working against it at the quarters
- The ocean basins, which turn the forces into waves that rotate around points of no tide and are amplified on wide shelves and in long bays
Scales
- time
- 12 h 25 min for the main lunar tide; 14.8 days from one spring tide to the next
- horizontal
- ocean basins, thousands of kilometres; each coast has its own
- vertical
- under 3 ft (1 m) of range on some coasts; about 30 ft (9 m) at Anchorage
- orlanski
- planetary
Equations
The tidal acceleration
- the difference between the pull on the near side of the earth and the pull at its centre, m s⁻²
- the gravitational constant, 6.674 × 10⁻¹¹ m³ kg⁻¹ s⁻²
- the mass of the moon (7.35 × 10²² kg) or the sun (1.99 × 10³⁰ kg)
- the radius of the earth, 6.371 × 10⁶ m
- the distance from the earth to the moon or the sun
Assumes The distance is much greater than the earth's radius, so only the first term of the difference matters. It is the force; the height of the tide on a coast depends on the ocean's response to it.
Working form For the moon, about 1.1 × 10⁻⁶ m s⁻², a nine millionth of gravity. The sun's is 0.46 of the moon's: its mass is 27 million times greater, but it is 389 times farther away, and the force falls with the cube of the distance.
The form number, which sorts a coast's tide
- the amplitudes of the two main daily constituents at the gauge
- the amplitudes of the main lunar and solar twice daily constituents
Assumes Amplitudes from the gauge's harmonic analysis. Under 0.25 the tide is semidiurnal; 0.25 to 1.5 mixed, mainly semidiurnal; 1.5 to 3 mixed, mainly diurnal; over 3 diurnal.
Signatures
- gauge
- two highs and two lows a day on a semidiurnal coast; one of each on a diurnal coast; the range swelling toward spring and shrinking toward neap every two weeks
- surface
- [object Object]
The numbers
| Quantity | Value, and the kind of number it is |
|---|---|
| Main lunar constituent M2 | 12.42 hoursStandard, Pugh 2014 |
| Main solar constituent S2 | 12.00 hoursStandard, Pugh 2014 |
| Daily constituents K1 and O1 | 23.93 and 25.82 hoursStandard, Pugh 2014 |
| Spring to spring | 14.77 days, half the 29.53 day cycle of the moon's phasesStandard, Pugh 2014 |
| Sun's tidal force against the moon's | 0.46Textbook, Pugh 2014 |
| Moon's distance | About 221,500 mi (356,500 km) at a close perigee to 252,700 mi (406,700 km) at a far apogee; the tidal force about a quarter stronger at a close perigee than at the mean distanceTextbook, Pugh 2014 |
| Form number | Under 0.25 semidiurnal, as on most of the Atlantic coast; 0.25 to 3 mixed, as on the Pacific coast; over 3 diurnal, as on parts of the Gulf coastTextbook, Pugh 2014 |
| Largest range in the United States | Cook Inlet, Alaska: about 30 ft (9 m) at AnchorageTypical |
How the station sees it
Tide gauges in the instrument atlas measure the water level every 6 minutes. Beside each measurement is the tide predicted for that minute, computed from dozens of constituents found in years of that gauge's record. The two lines normally lie on each other within centimetres. When they part, the difference is the weather: the wind and the pressure of a storm raising or lowering the sea. That difference, observed less predicted, is how the surge is measured.
- Tide gauges: the water level every 6 minutes, against the tide predicted for that minute
How it is warned
The tide is not warned; it is predicted, and published a year ahead for every gauge. The warnings it enters are the Coastal Flood Watch, Warning, Advisory and Statement, whose text names the times of high tide because that is when the water will be highest. A perigean spring tide is a common reason for an advisory on a calm day.
See also
- Coastal flood FB-EVT-105
- Storm tide, storm surge and wave runup FB-EVT-112
- Tide as a water machine FB-WAT-042
- Tide gauge FB-INS-008
- Seasons FB-CLK-001
- Sun and insolation FB-CLK-002
Sources
- American Meteorological Society. Glossary of Meteorology.
- Pugh, D. and P. Woodworth. Sea-Level Science (2014).
- NOAA National Ocean Service. Tides and Water Levels, an education tutorial.
- NOAA National Ocean Service. Tidal Datums.
Definition after the Glossary of Meteorology. Plate FB-CLK-003, revision 1, 2026-09-24. The number is permanent; cite it.