What it is
The atmosphere is a thin shell. Half of its mass lies below 18,000 ft (5.6 km), lower than the summit of Denali; nine tenths lies below 52,000 ft (16 km). On a globe 1 ft (30 cm) across, that nine tenths would lie within 0.02 in (0.4 mm) of its surface.
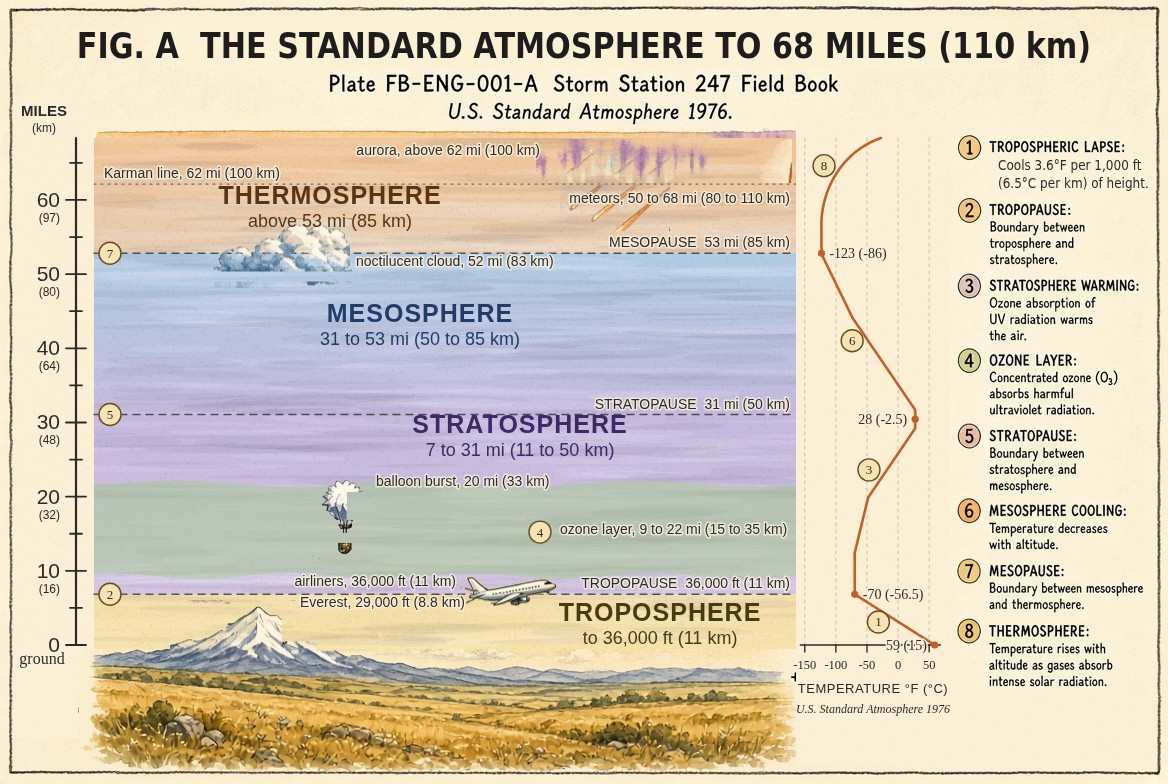
It is named in layers, and the layers are drawn by temperature. Fig. A draws the U.S. Standard Atmosphere, the average the aviation and engineering world agreed on in 1976: a single profile of temperature and pressure with height that no real day matches exactly, and every real day is measured against.
- The troposphere, from the ground to the tropopause. Temperature falls with height, 3.6 °F every 1,000 ft (6.5 °C a kilometre) in the standard atmosphere. Almost all the water vapour and almost all the weather are here.
- The stratosphere, from the tropopause to about 31 mi (50 km). Temperature is steady, then rises with height, because ozone here absorbs the sun's ultraviolet light and is heated by it.
- The mesosphere, from about 31 to 53 mi (50 to 85 km). Temperature falls again, to the coldest level of the atmosphere at the mesopause, near −123 °F (−86 °C).
- The thermosphere, above about 53 mi (85 km). The air is so thin that the little there is heats to hundreds of degrees under the sun's hardest radiation.
What it is not
It is not layered by composition. The main gases, nitrogen, oxygen and argon, are mixed in the same proportions from the ground to about 62 mi (100 km); only water vapour and ozone vary much. The layers are thermal.
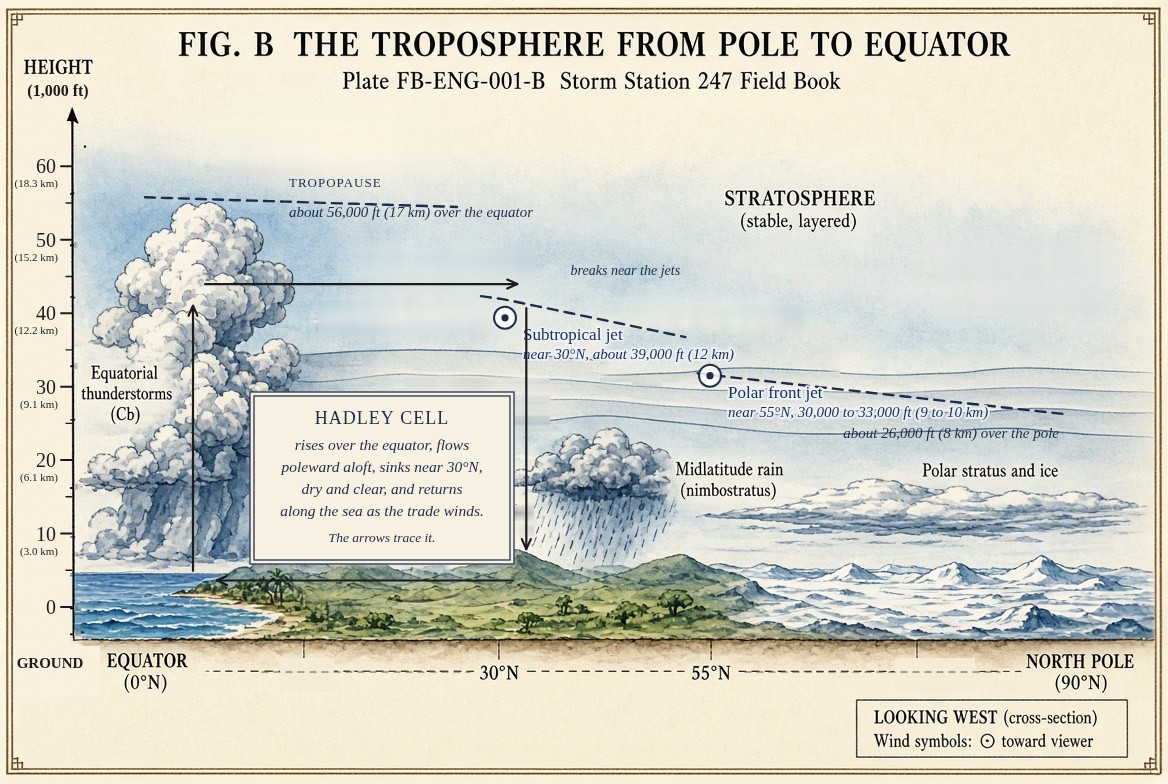
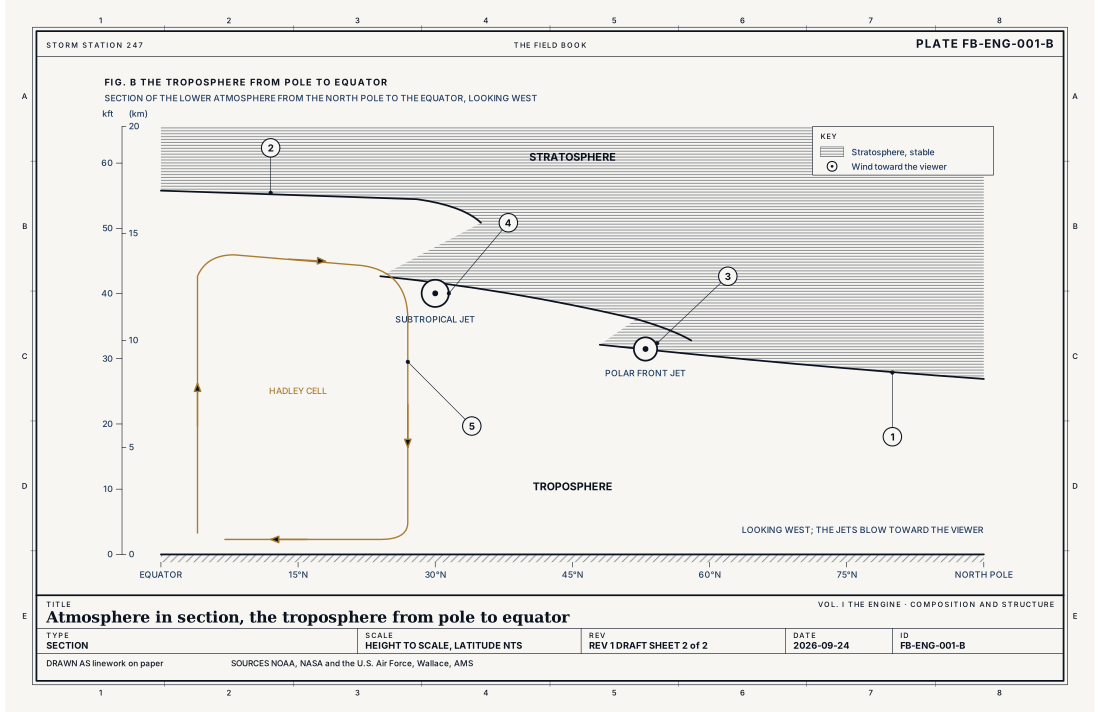
The tropopause is not at one height. It is about 26,000 ft (8 km) over the poles and 52,000 to 59,000 ft (16 to 18 km) over the equator, higher in summer than in winter, and it breaks where the jet streams run. Fig. B draws it from pole to equator.
There is no top. The air thins without end into space. The Karman line at 62 mi (100 km) is a convention for where spaceflight begins, not a surface the air knows.
Lookalikes
- Boundary layer
- The lowest 3,300 to 6,600 ft (1 to 2 km) of the troposphere, stirred by the ground each day. It is part of the troposphere, not a layer of its own in this sense.
- Ionosphere
- Layers of charged air in the mesosphere and thermosphere, defined by electricity, not temperature. It overlaps the layers on this plate.
- Space
- There is no top. The Karman line at 62 mi (100 km) is a convention, not a boundary the air observes.
The machine
Why it cools with height, then warms
The sun heats the atmosphere mostly from below. Sunlight passes through the troposphere and warms the ground, and the ground warms the air above it by contact, by radiation and by rising currents. Air that rises expands, because there is less air above it pressing down, and air that expands cools. So the troposphere is warm at the bottom and cool at the top, and it is always stirred: warm air below cooler air is the arrangement that turns over. That is why it holds the weather.
In the stratosphere the heat comes from within. Ozone absorbs ultraviolet light, and the absorption warms the layer most where the sunlight is strongest and the ozone plentiful enough, near 31 mi (50 km). Warm air above cooler air is stable: it resists being stirred. So the stratosphere is a lid. Thunderstorm tops spread out against it as anvils, and air that crosses into it stays for months or years.
Why the pressure falls with height
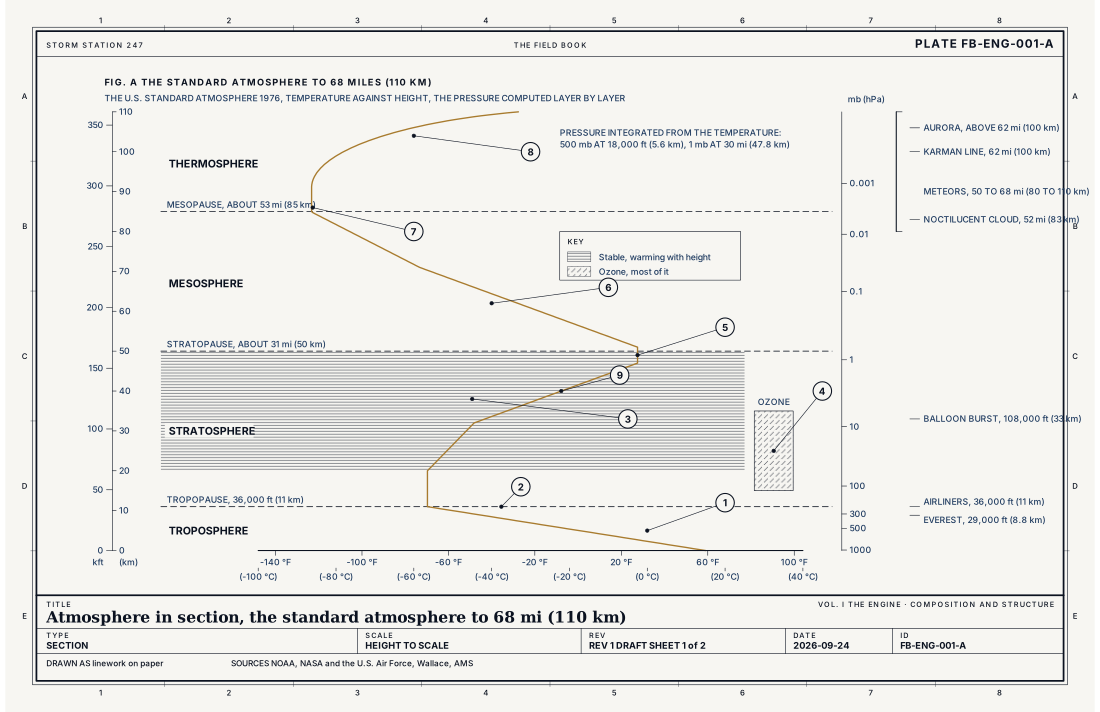
The pressure at any height is the weight of the air above it. Each layer is squeezed by the layers above, so the air is densest at the bottom, and the pressure falls fastest near the ground. The rule that expresses it is hydrostatic balance, the equation below: the pressure falls with height at the rate the weight of each thin slice of air requires. With the temperature known, it can be integrated layer by layer, as Fig. A's pressure scale is: 14.8 inHg (500 hPa) near 18,400 ft (5.6 km), 2.95 inHg (100 hPa) near 52,000 ft (16 km), 0.03 inHg (1 hPa) near 30 mi (48 km).
The drawings
Each figure drawn as an engineering sheet, its parts numbered, to print at 11 by 17.
- Troposphere
- Tropopause
- Stratosphere
- The ozone layer
- Stratopause
- Mesosphere
- Mesopause
- Thermosphere
- The temperature, standard atmosphere
- The tropopause, low at the pole
- The tropopause, high at the equator
- The polar front jet
- The subtropical jet
- The Hadley cell
Ingredients
- Heating from below: the sun warms the ground, and the ground warms the air, so the air cools with height through the troposphere
- Ozone absorbing ultraviolet sunlight in the stratosphere, which heats it from within and makes it warmer with height
- Gravity, which holds the air down and makes its pressure fall with height
Scales
- time
- the layers are permanent; their heights change with season and latitude
- horizontal
- the whole planet
- vertical
- 0 to about 330,000 ft (100 km) for everything weather touches; nine tenths of the air is below 52,000 ft (16 km)
- orlanski
- planetary
Equations
Hydrostatic balance and the fall of pressure with height
- the pressure at height z, hPa
- the density of the air, kg m⁻³
- gravity, 9.81 m s⁻²
- the pressure at the ground, about 1013 hPa at sea level
- the scale height, the height over which pressure falls by a factor of e
- the gas constant for dry air, 287 J kg⁻¹ K⁻¹
- the mean temperature of the layer, K
Assumes Hydrostatic balance holds everywhere except in the strongest updrafts. The exponential form assumes one temperature through the layer; with the real temperature it becomes the hypsometric equation, integrated layer by layer as Fig. A's pressure scale is.
Working form At 250 K the scale height is about 7.3 km (24,000 ft), and the pressure halves every 0.69 H, about 5 km (16,600 ft). In the warmer air of the lower troposphere the scale height is larger, and the pressure halves in about 5.5 km (18,000 ft).
Signatures
- sounding
- temperature falling with height to the tropopause; then steady or rising; the tropopause where a balloon's temperature stops falling
- satellite
- cloud tops flattening at the tropopause into anvils
- surface
- the station pressure; which is the weight of all the air above the station
The numbers
| Quantity | Value, and the kind of number it is |
|---|---|
| Sea level | 59 °F (15 °C), 29.92 inHg (1013.25 hPa), in the standard atmosphereStandard, U.S. Standard Atmosphere |
| Lapse rate in the troposphere | 3.6 °F per 1,000 ft (6.5 °C per km), standard; the real rate varies from day to dayStandard, U.S. Standard Atmosphere |
| Tropopause | 36,000 ft (11 km) and −69.7 °F (−56.5 °C) in the standard atmosphere; about 26,000 ft (8 km) near the poles to 52,000 to 59,000 ft (16 to 18 km) near the equatorStandard, U.S. Standard Atmosphere |
| Stratopause | About 154,000 to 167,000 ft (47 to 51 km), near 27.5 °F (−2.5 °C)Standard, U.S. Standard Atmosphere |
| Mesopause | About 279,000 ft (85 km), near −123 °F (−86 °C), the coldest level in the standard atmosphereStandard, U.S. Standard Atmosphere |
| 14.8 inHg (500 hPa) | About 18,000 ft (5.6 km): half the air is below itStandard, U.S. Standard Atmosphere |
| 0.03 inHg (1 hPa) | About 157,000 ft (48 km): 99.9 percent of the air is below itStandard, U.S. Standard Atmosphere |
| Ozone | Most between about 49,000 and 115,000 ft (15 and 35 km)Typical, Wallace 2006 |
How the station sees it
A surface station measures the bottom of the column. Its barometer reads the weight of all the air above it, and its thermometer the air that the ground has warmed.
The column itself is measured by weather balloons: radiosondes launched twice a day from about 90 stations the Weather Service runs, reporting temperature, humidity and wind as they rise, until they burst near 19 to 22 mi (30 to 35 km). Each launch is a real profile, and each departs from the standard one. Where it is steeper, storms can grow; where it warms with height near the ground, the air is capped.
- Airport weather stations: the bottom of the column: temperature and the pressure of all the air above
- The temperature layer on the live map: the analysed temperature across the country, at the bottom of the troposphere
How it is warned
The layers are not warned. They are the frame every warning sits in: a thunderstorm's anvil at the tropopause, a hurricane's outflow near 49,000 ft (15 km), an inversion that traps smoke near the ground. The plates that are warned describe the weather inside this frame.
See also
- Composition of air FB-ENG-002
- Hydrostatic balance FB-ENG-003
- Lapse rates and stability FB-ENG-005
- Radiation budget FB-ENG-007
- Radiosonde FB-INS-004
- Thunderstorm FB-EVT-001
- Cloud classification FB-SKY-001
Sources
- NOAA, NASA and the U.S. Air Force. U.S. Standard Atmosphere, 1976.
- Wallace, J. M. and P. V. Hobbs. Atmospheric Science, An Introductory Survey, 2nd ed. (2006).
- American Meteorological Society. Glossary of Meteorology.
Definition after the Glossary of Meteorology. Plate FB-ENG-001, revision 1, 2026-09-24. The number is permanent; cite it.