What it is
A lapse rate is how fast the temperature falls with height. There are two kinds, and stability is the comparison between them.
The first belongs to the air that stays put: the temperature a balloon measures at each height on a given day. In the standard atmosphere it falls 3.6 °F every 1,000 ft (6.5 °C a km), but the real one changes by the hour.
The second belongs to air that moves. Air that rises expands, and expanding air cools even though it trades no heat with its surroundings. While it is dry it cools 5.4 °F every 1,000 ft (9.8 °C a km), the dry adiabatic rate. Once it is saturated, its vapour condenses as it rises, the condensing releases heat, and it cools more slowly.
Lift a small parcel of air and compare it with the air around it at its new height. If it is colder, it is heavier and sinks back: the air is stable. If it is warmer, it keeps rising: the air is unstable.
What it is not
It is not the temperature itself. Cold air can be unstable and hot air stable; only the rate of change with height matters.
It is not the same at every height. One sounding can be unstable near the ground, stable in an inversion above, and unstable again higher up, and each layer behaves by its own rule.
Lookalikes
- The standard atmosphere
- A fixed average profile, 3.6 °F per 1,000 ft; a real day departs from it, and the departure is what makes weather.
- An inversion
- A layer where the temperature rises with height, the most stable air there is.
- CAPE
- The energy a rising parcel gains over its whole climb; stability here is the rule at each level.
The machine
Three kinds of stability
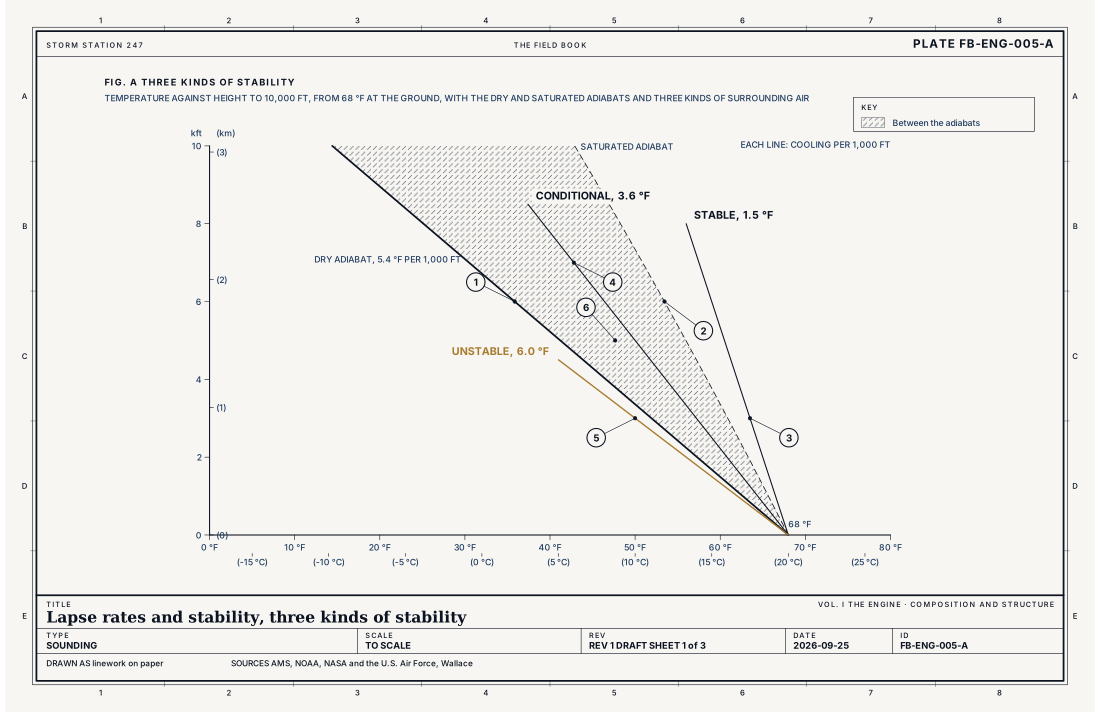
Fig. A draws every case from one ground temperature, 68 °F (20 °C). When the surrounding air cools more slowly than even the saturated rate, any lifted parcel ends up colder: absolutely stable. When it cools faster than the dry rate, any lifted parcel ends up warmer: absolutely unstable, a state that lasts only near sunbaked ground on a summer afternoon. Between the two adiabats lies conditional instability: stable to dry air, unstable to saturated air. The standard atmosphere's 3.6 °F every 1,000 ft sits in that wedge, and so does most of the real troposphere on most days. Whether storms grow depends on whether something lifts the air far enough to saturate it.
Lifted, and let go
The first equation below puts numbers on it, and Fig. B draws them. A dry parcel lifted 3,000 ft cools to 51.9 °F. In air cooling 3.6 °F every 1,000 ft, the air around it is 57.2 °F, so the parcel is 5.3 °F (2.9 °C) colder and sinks back. It overshoots its old level, is pushed up again, and bobs. The second equation gives the time for one bob, about 10 minutes in the standard lower atmosphere. Wind carrying that bobbing across a ridge draws it out into the standing waves and lens clouds of the mountains, Orographic clouds FB-SKY-035.
In air cooling 6.0 °F every 1,000 ft, the air around the parcel is 50.0 °F, so the parcel is 1.9 °F (1.1 °C) warmer and keeps going. The difference grows as it climbs.
How fast saturated air cools
The saturated rate is not one number. Warm air holds more vapour and releases more heat as it rises, so it cools slowly; cold air holds little and cools almost at the dry rate. Fig. C computes it: at 1,000 mb, 2.3 °F every 1,000 ft (4.2 °C a km) at 68 °F (20 °C), 3.6 °F every 1,000 ft (6.5 °C a km) at freezing, and 4.7 °F every 1,000 ft (8.6 °C a km) at −4 °F (−20 °C). That is why warm, humid air is where the tallest thunderstorms grow, Thunderstorm FB-EVT-001.
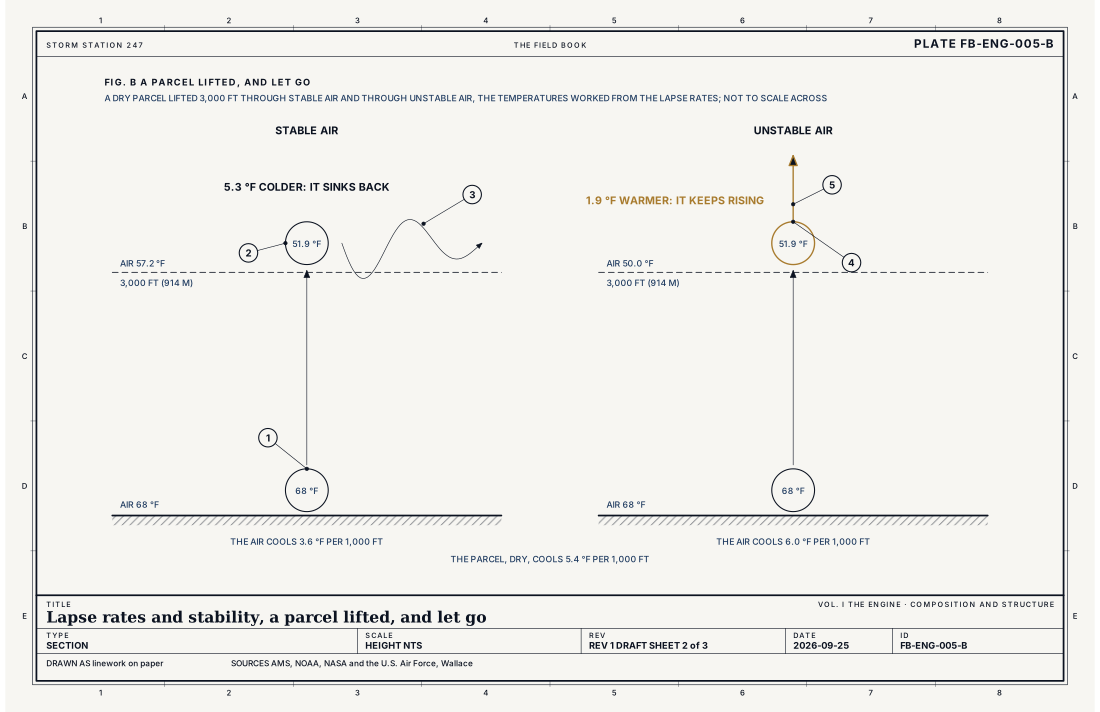
- The parcel at the ground
- Lifted into stable air, colder than its surroundings
- It sinks back and bobs
- Lifted into unstable air, warmer than its surroundings
- It keeps rising
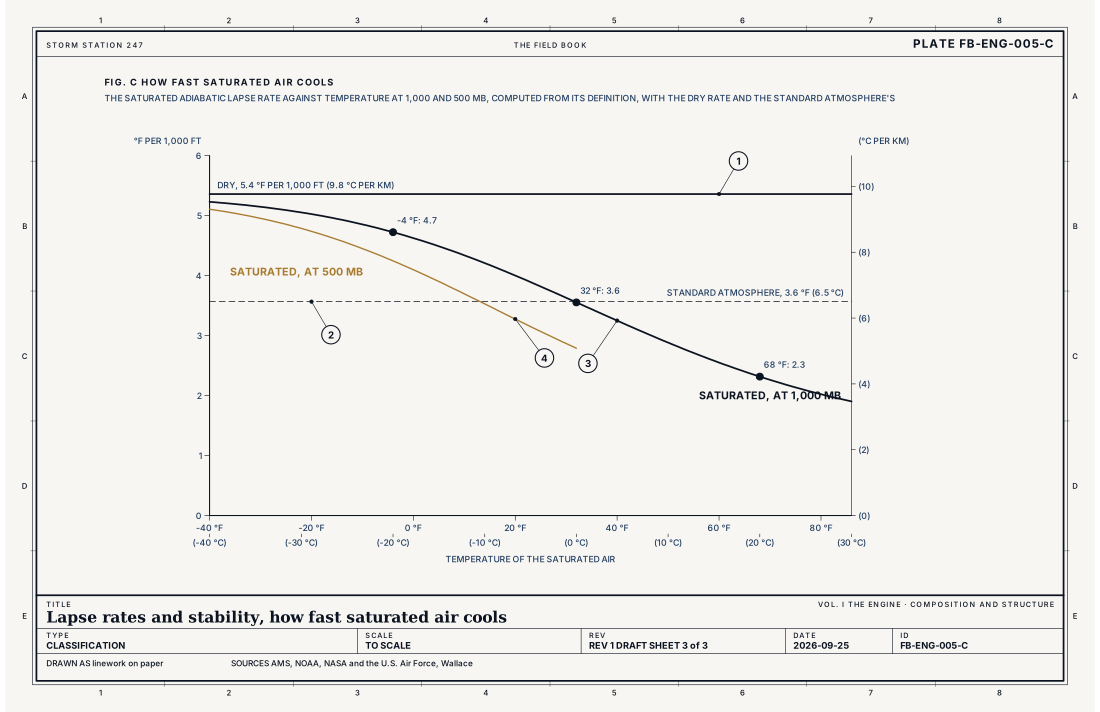
- The dry rate
- The standard atmosphere's rate
- The saturated rate at 1,000 mb
- The saturated rate at 500 mb
Ingredients
- Air that rises expands and cools, and air that sinks is squeezed and warms, without trading heat with its surroundings
- Water vapour that condenses as saturated air rises, releasing heat that slows its cooling
- The temperature of the surrounding air at each height, which the sun, the ground, fronts and sinking air all change
Scales
- time
- minutes for a parcel to bob or rise; hours for the sun or a front to change the lapse rate
- horizontal
- from one thermal a few hundred feet (100 m) across to a whole air mass
- vertical
- the lowest few thousand feet on a sunny afternoon to the whole troposphere
- orlanski
- meso
Equations
A lifted parcel against its surroundings
- how much warmer the parcel is than the air around it after the lift, °F
- how fast the surrounding air cools with height, °F per 1,000 ft
- how fast the parcel cools as it rises, 5.4 °F per 1,000 ft (9.8 °C per km) while it is dry
- how far the parcel is lifted, in thousands of feet
Assumes The parcel method; the parcel trades no heat with its surroundings and does not disturb them. A parcel warmer than its surroundings is buoyant and rises; a colder one sinks.
Working form A dry parcel lifted 3,000 ft through air cooling 3.6 °F per 1,000 ft ends 5.3 °F (2.9 °C) colder than its surroundings, and sinks back. Through air cooling 6.0 °F per 1,000 ft it ends 1.9 °F (1.1 °C) warmer, and keeps rising.
The buoyancy frequency
- how fast a nudged parcel bobs in stable air, per second
- gravity, 9.81 m s⁻²
- the temperature of the air, K
- the dry adiabatic lapse rate, 9.8 K per km
- the lapse rate of the surrounding air, K per km
Assumes Dry air, small displacements; in unstable air the root has no real value and the parcel does not bob, it runs away.
Working form In the standard lower atmosphere, 59 °F (15 °C) and cooling 3.6 °F per 1,000 ft (6.5 °C per km), a nudged parcel bobs up and down once about every 10 minutes.
Signatures
- sounding
- the temperature line leaning left of the dry adiabat near the ground on a hot afternoon; an inversion; warming with height; as a lid; conditional instability through most of the troposphere most days
- surface
- strong gusts and dust devils under a superadiabatic layer; still air; fog and trapped smoke under an inversion
- satellite
- flat layer clouds in stable air; cumulus towers in unstable air
- radar
- steady; widespread rain from lifted stable air; scattered cells from unstable air
The numbers
| Quantity | Value, and the kind of number it is |
|---|---|
| Lapse rate | The rate at which an atmospheric variable, usually temperature, decreases with heightStandard, Glossary of Meteorology |
| Dry adiabatic lapse rate | 5.4 °F per 1,000 ft (9.8 °C per km)Standard, Glossary of Meteorology |
| Saturated adiabatic lapse rate at 1,000 mb | 2.3 °F per 1,000 ft (4.2 °C per km) at 68 °F (20 °C); 3.6 °F per 1,000 ft (6.5 °C per km) at 32 °F (0 °C); 4.7 °F per 1,000 ft (8.6 °C per km) at −4 °F (−20 °C)This site, Glossary of Meteorology |
| The standard atmosphere | 3.6 °F per 1,000 ft (6.5 °C per km) from the ground to 36,000 ft (11 km)Standard, U.S. Standard Atmosphere |
| Absolutely stable | The air cools more slowly than the saturated adiabatic rateStandard, Glossary of Meteorology |
| Conditionally unstable | The air cools faster than the saturated rate but more slowly than the dry rate: stable to dry air, unstable to saturated airStandard, Glossary of Meteorology |
| Absolutely unstable | The air cools faster than the dry adiabatic rateStandard, Glossary of Meteorology |
How the station sees it
A surface station sees the bottom of the column. On a sunny afternoon its temperature climbs until the lowest layer cools faster than the dry rate, and then the air turns over: gusts, cumulus, dust devils. On a clear, calm night its temperature falls below the air a few hundred feet up, an inversion, and fog, frost and smoke collect under it. Road weather stations on mountain passes show the inversion directly when the pass reads warmer than the valley below.
The full profile comes from weather balloons, plotted on the skew T chart that forecasters read stability from, How to read a skew T FB-STN-003.
- Airport weather stations: the temperature at the bottom of the column, which the afternoon sun raises until the lowest layer turns unstable
- Road weather stations: the air in the valleys and on the passes, where an inversion shows as the pass warmer than the valley
How it is warned
Stability is not warned. It is the setting a forecaster reads first each morning, because it decides whether the day brings flat cloud and steady rain or towers, hail and tornadoes, and what an air quality alert will do under an inversion.
See also
- Atmosphere in section FB-ENG-001
- Hydrostatic balance FB-ENG-003
- Potential temperature FB-ENG-004
- CAPE, CIN and the sounding FB-ENG-006
- Cumulus FB-SKY-018
- Orographic clouds FB-SKY-035
- Thunderstorm FB-EVT-001
- How to read a skew T FB-STN-003
Sources
- American Meteorological Society. Glossary of Meteorology.
- NOAA, NASA and the U.S. Air Force. U.S. Standard Atmosphere, 1976.
- Wallace, J. M. and P. V. Hobbs. Atmospheric Science, An Introductory Survey, 2nd ed. (2006).
Definition after the Glossary of Meteorology. Plate FB-ENG-005, revision 1, 2026-09-25. The number is permanent; cite it.